The Real Observability Story in .NET 10
For years, .NET’s observability has been described as “good, but manual”. The building blocks have existed since .NET 5 and matured significantly in .NET 6 through .NET 8. Activity, ActivitySource, DiagnosticSource, EventCounters, Meter, ILogger, and later OpenTelemetry hooks have all been there. What was missing was not capability, but coherence. You could instrument almost anything, but you had to know exactly where to hook in, what to name things, and how to correlate them.
.NET 10 does not introduce a single headline observability feature. Instead, it tightens the system in ways that only become obvious once you are running real production workloads. The changes are subtle, but they reduce friction, remove ambiguity, and make it much harder to accidentally build an unobservable system.
This post explains what has actually changed, why it matters, and how it alters the way you should think about instrumentation going forward.
From Available to Expected
Before .NET 10, observability APIs were opt-in in a practical sense. Even when libraries emitted activities or metrics, there was no strong expectation that applications would consume them consistently. Naming conventions varied. Correlation worked if you were careful. Metrics often required explicit wiring that teams postponed until after the first incident.
.NET 10 quietly moves observability from an optional concern to an assumed capability. Framework-level components now emit richer, more consistent telemetry by default, and the APIs push you toward OpenTelemetry-aligned patterns rather than bespoke conventions.
The important consequence is this, instrumentation is no longer something you add later. If you build on top of the .NET 10 defaults, you are observable unless you actively opt out.
ActivitySource Grows Up
ActivitySource has been the backbone of distributed tracing in .NET since .NET 5, but it suffered from two long-standing issues. First, many libraries created sources without clear ownership or consistent naming. Second, there was no strong alignment with OpenTelemetry schemas, which made downstream analysis brittle.
.NET 10 addresses this by allowing ActivitySource to be explicitly associated with a telemetry schema. This seems minor, but it has a big effect on trace quality in multi-service systems.
Consider a service emitting a custom activity in .NET 8:
private static readonly ActivitySource Source =
    new("Billing.Service");

using var activity = Source.StartActivity("Invoice.Generate");
This works, but downstream systems have no guarantee about attribute names, semantic meaning, or compatibility with standard dashboards.
In .NET 10, you can anchor this source to a known schema:
private static readonly ActivitySource Source =
    new(
        name: "Billing.Service",
        version: "1.0.0",
        telemetrySchemaUrl: "https://opentelemetry.io/schemas/1.21.0"
    );
Now the runtime, exporters, and backends have a shared understanding of what this telemetry represents. Over time, this makes cross-service analysis far more reliable, especially in heterogeneous systems where not everything is written in .NET.
This is one of those changes that does nothing for a single service, but pays dividends once you operate dozens.
Metrics Are No Longer Second-Class
Metrics in .NET have historically lagged tracing in adoption. The Meter API has existed, but framework-level metrics were sparse, inconsistent, or too low-level to be directly useful.
.NET 10 expands built-in metrics across ASP.NET Core, identity pipelines, and request handling in ways that reduce the need for custom instrumentation. You get clearer visibility into request lifetimes, authentication overhead, and internal pipeline behaviour without writing any code.
This is important because metrics answer different questions than traces. Traces tell you why something failed. Metrics tell you that something is degrading before it fails.
In practical terms, .NET 10 pushes teams toward a healthier balance between tracing and metrics. You can rely on the platform for baseline signals, and reserve custom meters for domain-specific measurements that actually matter.
Logs, Traces, and Metrics Finally Line Up
One of the most common observability failures in .NET systems is broken correlation. Logs exist, traces exist, metrics exist, but stitching them together requires luck and institutional knowledge.
.NET 10 improves correlation by tightening the integration between logging scopes, activities, and meters. When an activity is active, logs written through ILogger now consistently inherit trace context without additional configuration. Metrics emitted inside an activity can be associated with the same logical operation.
The result is a simpler mental model. If code runs inside an activity, everything it emits belongs to that operation unless you explicitly say otherwise.
This may sound obvious, but in earlier versions it was easy to break accidentally, especially in asynchronous or event-driven flows.
Observability in Asynchronous and Event-Driven Systems
This is where .NET 10’s improvements matter most. Modern .NET systems rely heavily on asynchronous messaging, background processing, and serverless execution. These are precisely the areas where observability has traditionally fallen apart.
In .NET 10, framework components that bridge execution boundaries do a better job of preserving context. Activities flow more reliably across async boundaries. Background work triggered by ASP.NET Core or hosted services retains correlation information. This reduces the number of “orphaned” traces that start in the middle of nowhere.
For systems built around queues, event handlers, or orchestrators, this change alone can cut investigation time dramatically.
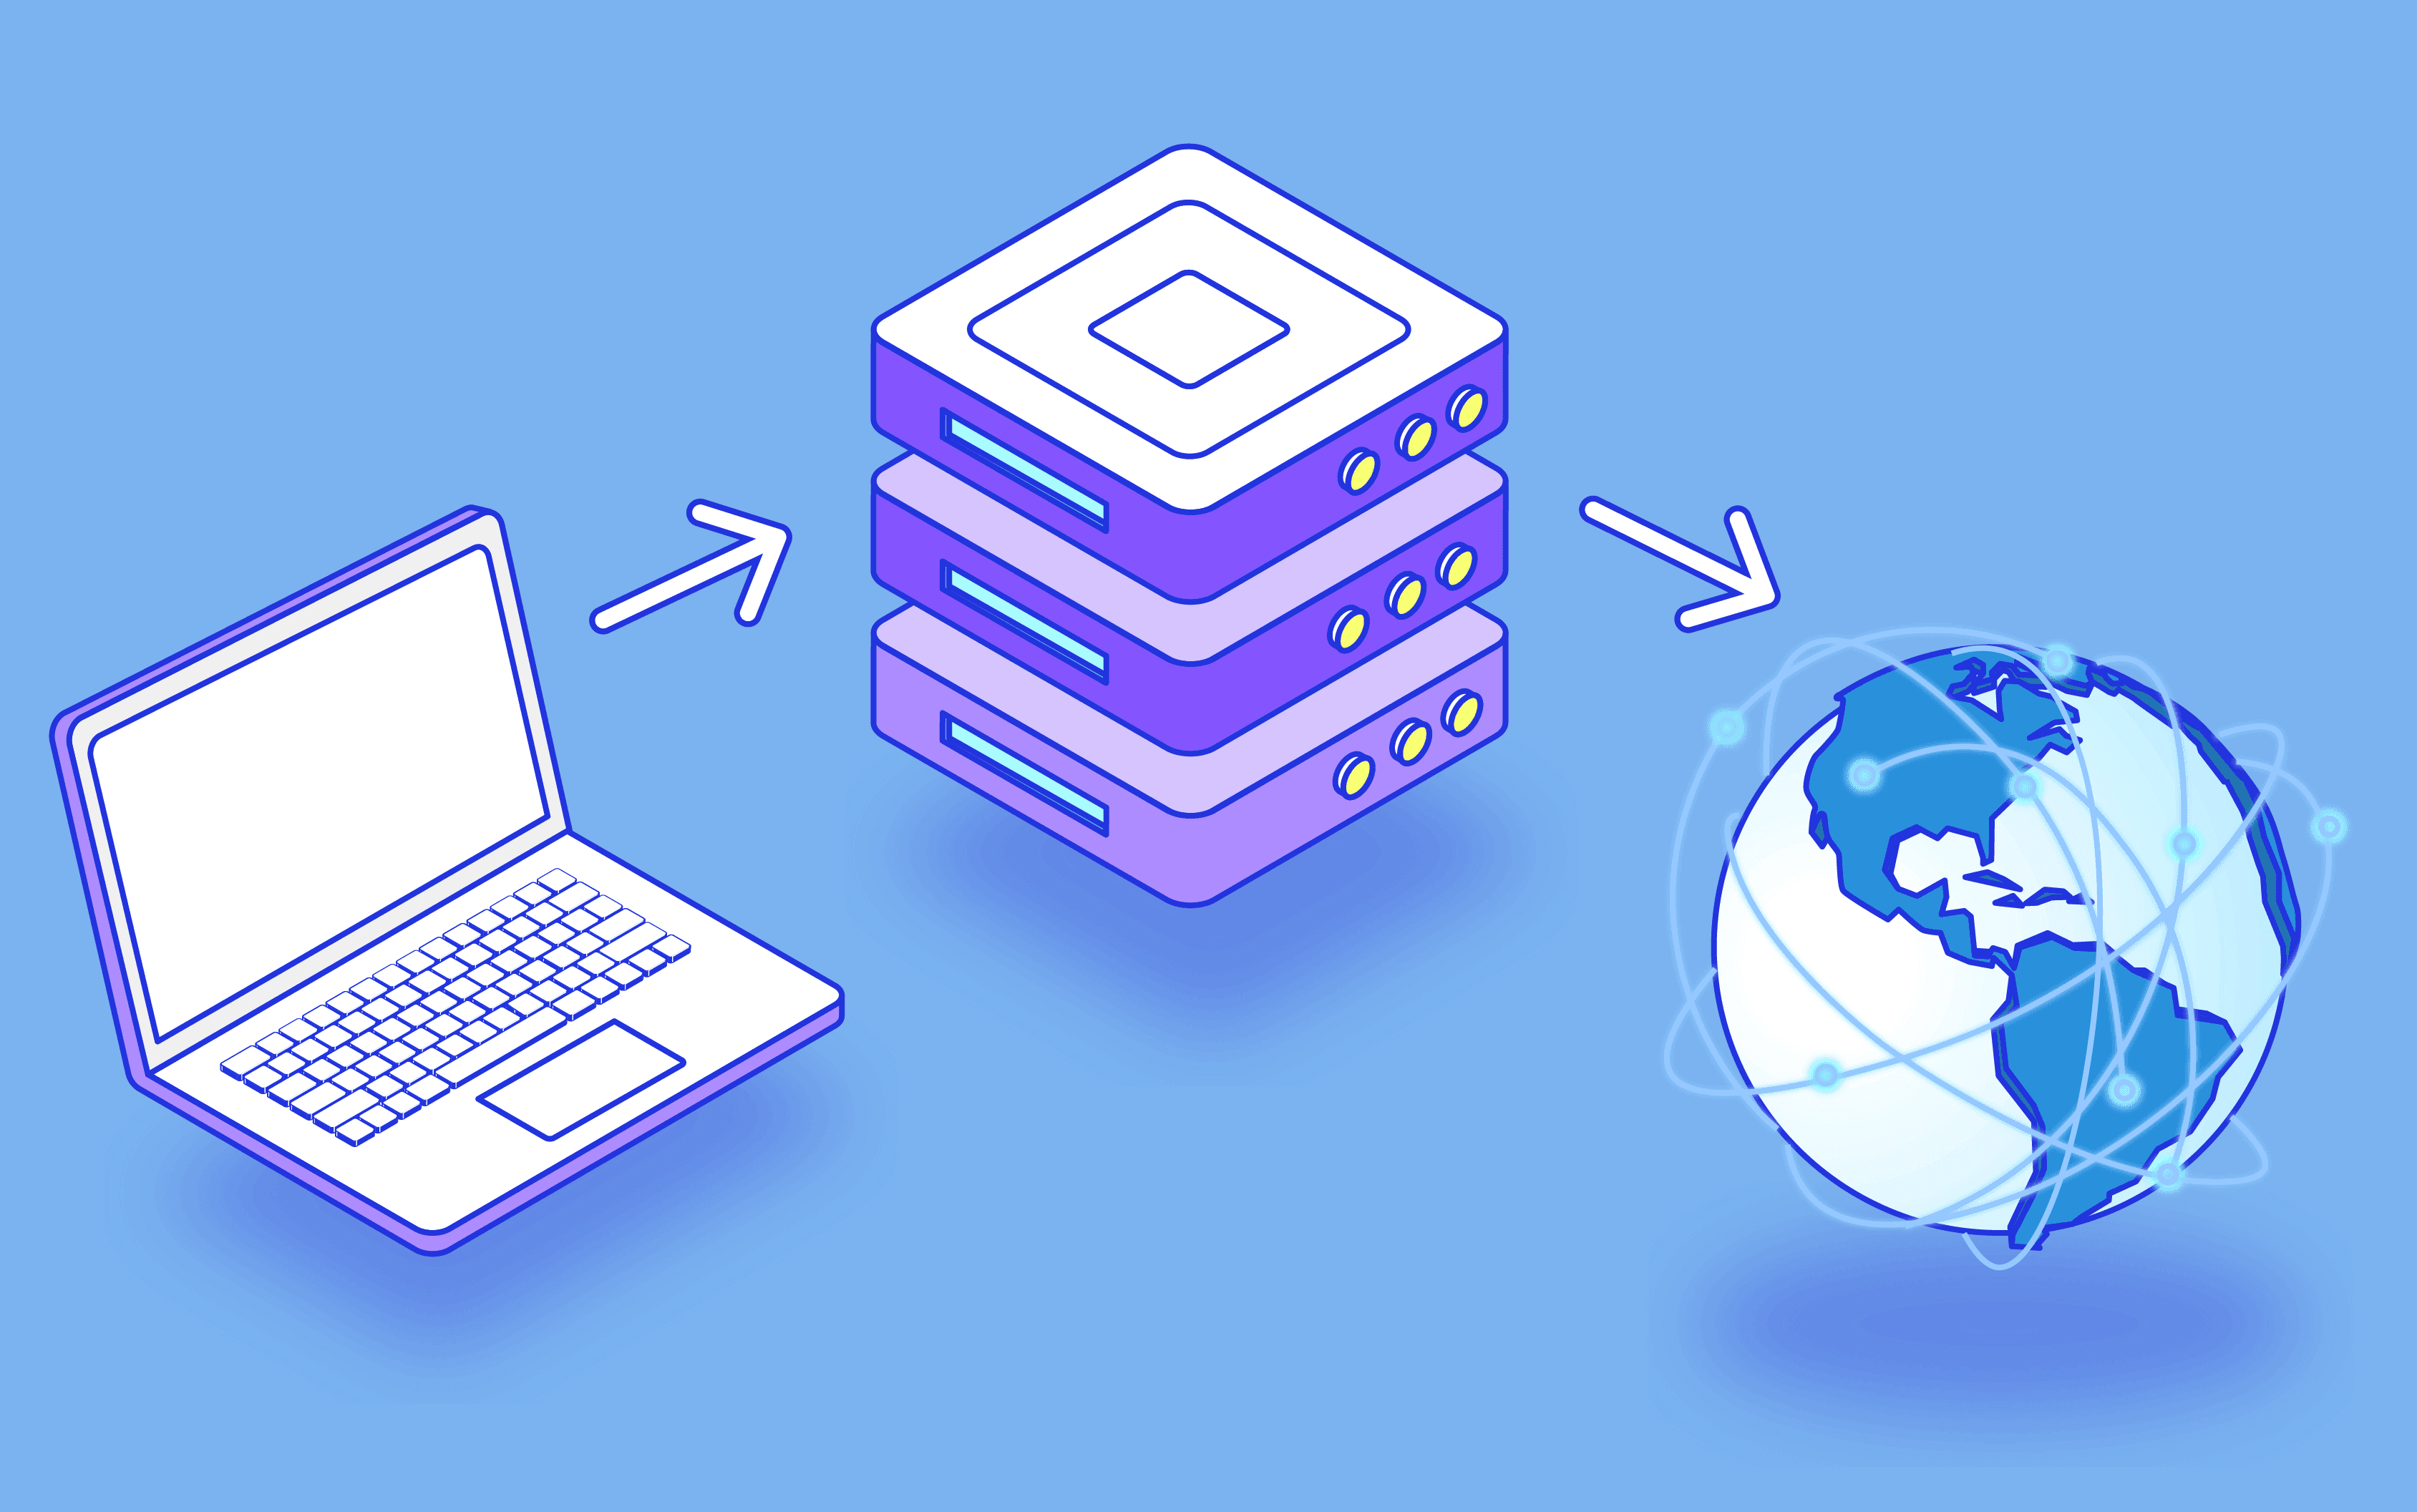
A Concrete Example: Request to Background Work
Take a simple flow where an HTTP request enqueues background processing.

In earlier versions of .NET, it was common for the trace to stop at the queue boundary unless you manually propagated context. Logs from the worker would appear disconnected, even though they were causally related.
With .NET 10’s improved defaults and OpenTelemetry alignment, the expectation is that this context flows naturally if you use supported integrations. The trace becomes continuous, and logs from the worker can be correlated back to the originating request.
This does not remove the need for good design, but it raises the baseline.
Blazor, MAUI, and Client-Side Visibility
Observability has traditionally focused on servers. .NET 10 extends the same principles into client-side frameworks, particularly Blazor WebAssembly and MAUI.
These environments now emit richer diagnostic information through the same Activity and Meter APIs. That means client-side rendering delays, layout measurements, and lifecycle events can be observed using the same tooling you already use on the server.
The significance here is consistency. You no longer need a separate mental model for “frontend telemetry” and “backend telemetry” It is all the same system, expressed at different layers.
What Has Not Changed
It is important to be clear about what .NET 10 does not do. It does not replace OpenTelemetry. It does not force a specific backend. It does not automatically make your system observable if you ignore instrumentation entirely.
What it does is remove excuses. The platform now provides sensible defaults, stronger conventions, and better alignment with industry standards. If your system is still opaque, it is almost certainly a design choice rather than a tooling limitation.
How This Should Change Your Architecture
The most important takeaway is not an API detail. It is a shift in responsibility.
In earlier versions of .NET, observability was something platform teams bolted on. In .NET 10, it becomes part of application design. Activities define boundaries. Metrics describe behaviour. Logs explain decisions.
If you are building modular monoliths, this aligns perfectly with explicit boundaries. Each module owns its ActivitySource. Each boundary emits metrics that describe its health. Cross-module calls become traceable without leaking internals.
If you are building distributed systems, the same principles apply at a larger scale.
.NET 10’s Observability
The improvements are easy to miss because they are not flashy. There is no single feature to demo. No screenshot that sells the idea. What you get instead is a platform that assumes you care about understanding your system in production. It nudges you toward better defaults, stronger conventions, and fewer foot-guns. For people that already value observability, .NET 10 reduces effort and increases signal quality. For those that have postponed it, the platform is quietly removing the reasons why.
That is exactly the kind of change that matters long after the release notes are forgotten.